We analyze the S&P 500 (SPX) through the lens of the Elliott Wave Principle (EWP), which enables us to discern potential market trajectories based on established patterns that must comply with specific price-based guidelines.
Given that predicting the future is inherently uncertain, the EWP assists us in recognizing the most probable courses of action. Furthermore, because financial markets operate in a non-linear, stochastic, and probabilistic manner, we must, like any other field that forecasts intricate systems, always “anticipate, monitor, and adjust if necessary.”
In our most recent update (see here), prior to the FED’s interest rate decision, we suggested that the market would not face a downturn from the announcement, as our favored outlook indicates a complex, overlapping ending diagonal (ED), targeting SPX6000+. We expect that
“green W-a/1 of the red W-iii/c will be completed soon, and the green W-b/2 should ideally aim for $5525+/25, from which the green W-3/c can ideally lead to $5950+/-25.”
Looking ahead, the market only reached $5615, marking a modest 23.60% retracement of the rally initiated on September 6. See Figure 1 below. This shallow retracement was less than the anticipated 50.0-76.0% range that informed our forecast, yet rarity does not equate to impossibility. Subsequently, the index has risen, lending credence to our theory of an “ED-to-$6000+.” Now, we turn to the current price chart to assess whether Friday’s crucial US Nonfarm Payroll (NFP) report could potentially crash the stock market. See Figure 1 below.
Figure 1. Daily SPX chart with detailed EWP count and technical indicators

Our current view of the price movements (since the notable October 2022 low) indicates that the index completed the (black) major W-3 and W-4 this summer and is now advancing through the black W-5, which is taking shape as a (contracting) ending diagonal (ED) pattern.
EDs consist of a 3-3-3-3-3 structure and are initially indistinguishable from a correction characterized by a 3-3-3 pattern. Therefore, it takes time to confidently assert that the SPX is forming an ED.
The index also exhibited an ED during the February-March rally. Refer to the blue box in Figure 1, which clearly illustrates its overlapping abc’s. We should anticipate a similar occurrence over the upcoming months, but on a larger scale, as that was a (green) minor-5 wave, whereas the current rally should represent a two-degree larger Major wave.
In light of this, we expect the green W-a/1 and b/2 of the red W-iii/c to be completed, leading into the green W-3/c targeting SPX5950+/-25. The latter may further subdivide, as depicted in the one-degree lower grey W-a, -b, and -c. The Bears have managed to push the price below the continuously elevated (blue) warning level for the Bulls but have, for now, stalled at the grey, 2nd warning level.
The Bulls would face greater challenges if the price breaks below that level, particularly below the orange, 3rd warning level at the FED-Wednesday low of $5615, as this would heighten the likelihood of the market dropping below the September 6 low at $5402. Given the complex nature of markets, we must remain cautious about the possibility that our analysis might be incorrect. Thus, the rally stemming from the August 5 low could also merely represent an extended three-wave rally—a corrective B-wave. See Figure 2 below.
Figure 2. Daily SPX chart with detailed EWP count and technical indicators
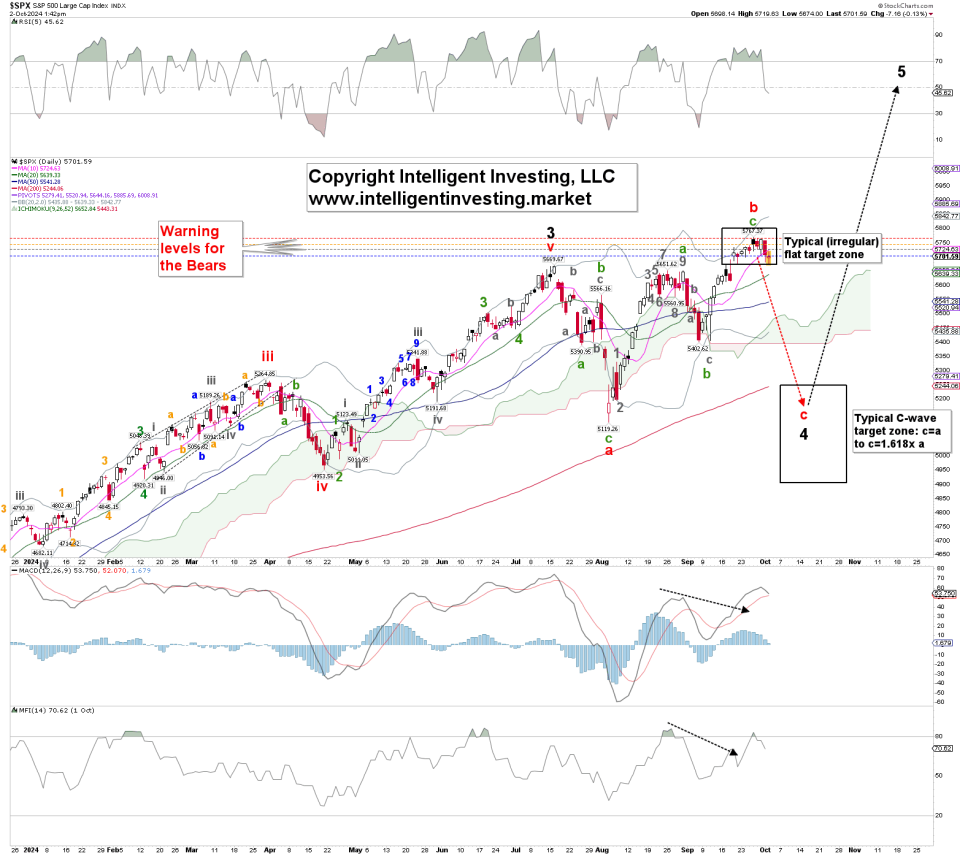
In our earlier update, we noted that “the black W-4 could [transform] into a flat correction. A flat correction often has a=b=c, leading to the red W-c potentially falling back to the $5100 level.” We still cannot dismiss this possibility since the index has reached the usual target zone for the B-wave of an (irregular) flat: b=a to b=1.236x a. Therefore, a prolonged 5-3-5, a-b-c structure may have completed last week’s peak.
However, a break below the September 6 low, particularly with serious implications below $5490, would confirm this scenario. At that point, we could see the beginning of the black W-5. Nonetheless, this analysis remains as our alternative perspective, serving as an “insurance policy,” as the index continues to trend higher.
In our previous update, we concluded with, “unless we are completely mistaken, we do not foresee the FED’s rate decision causing the market to crash,” and this prediction proved accurate. Utilizing the EWP, we understand that following W-4 must come W-5, leading us to see the worst-case scenario as a decline to around ~$5100+/-200.
Contrarily, the projected drop to ideally $5525+/25 only reached $5615. Nevertheless, we believe the expected follow-up rally could potentially extend to as high as $6000, provided that it stays above the September 6 low at $5402.
Related Articles
3 High-Yield Dividend Gems Analysts Favor Amid Falling Rates
Stocks: Long-Term Return Forecasts Make Strong Case for Global Diversification